


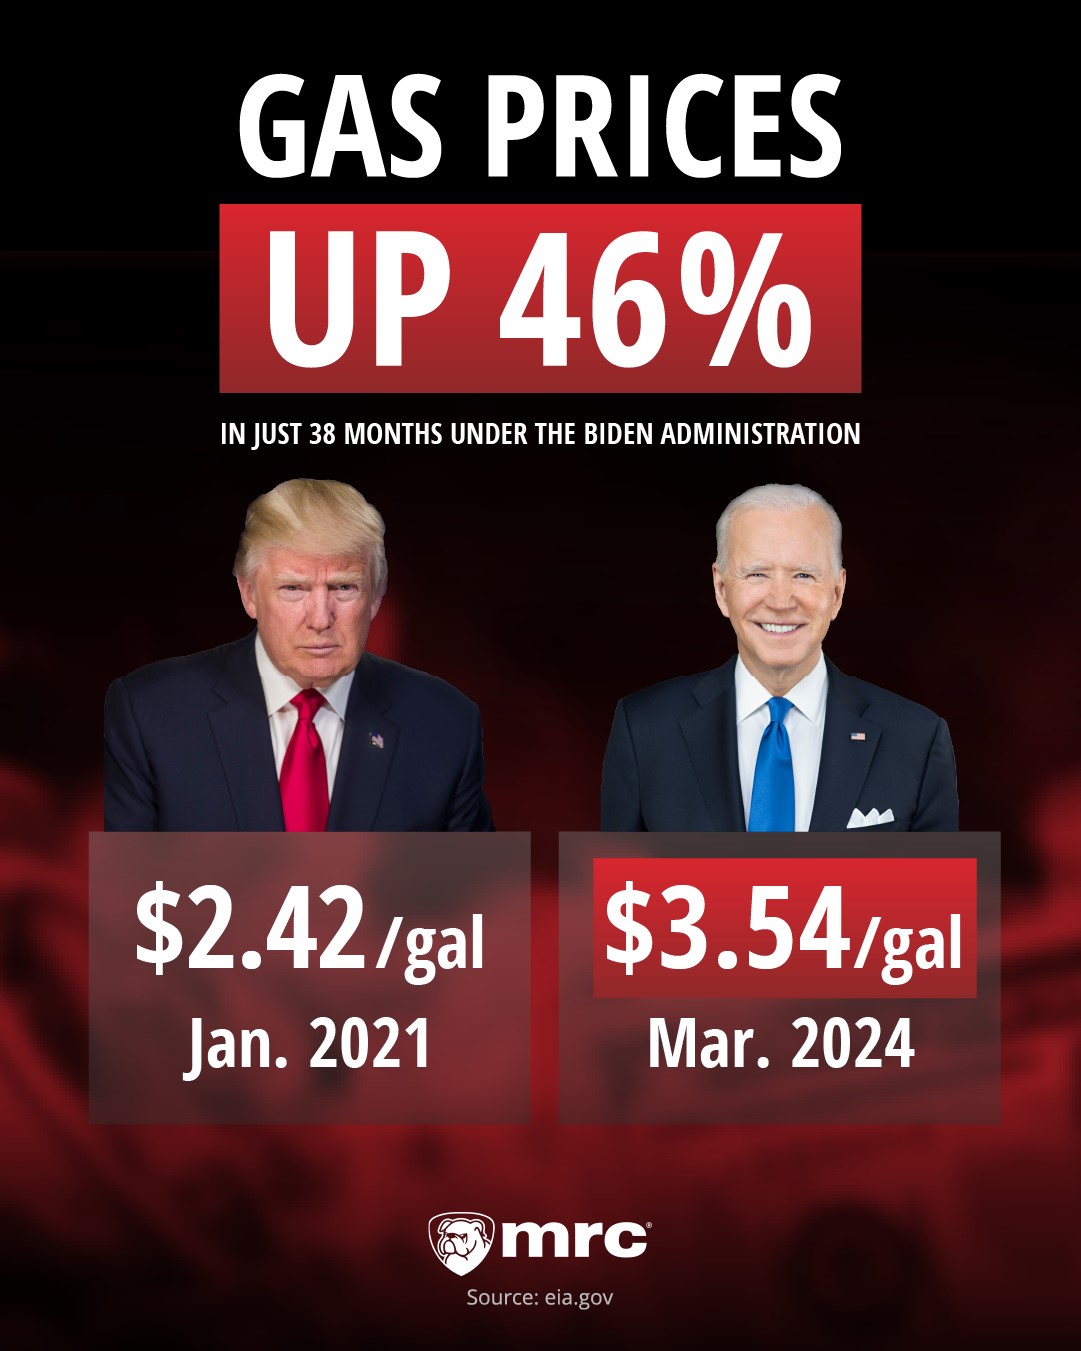
Gas prices:
While gas prices held steady under Pres. Donald Trump (down four cents a gallon), they’ve surged 46% in the first 38 months of Pres. Joe Biden’s term. From January 2021 to March of 2024, the average price of a gallon of gas (all grades) has increased from $2.42 to $3.54, according to the U.S. Energy Information Administration.
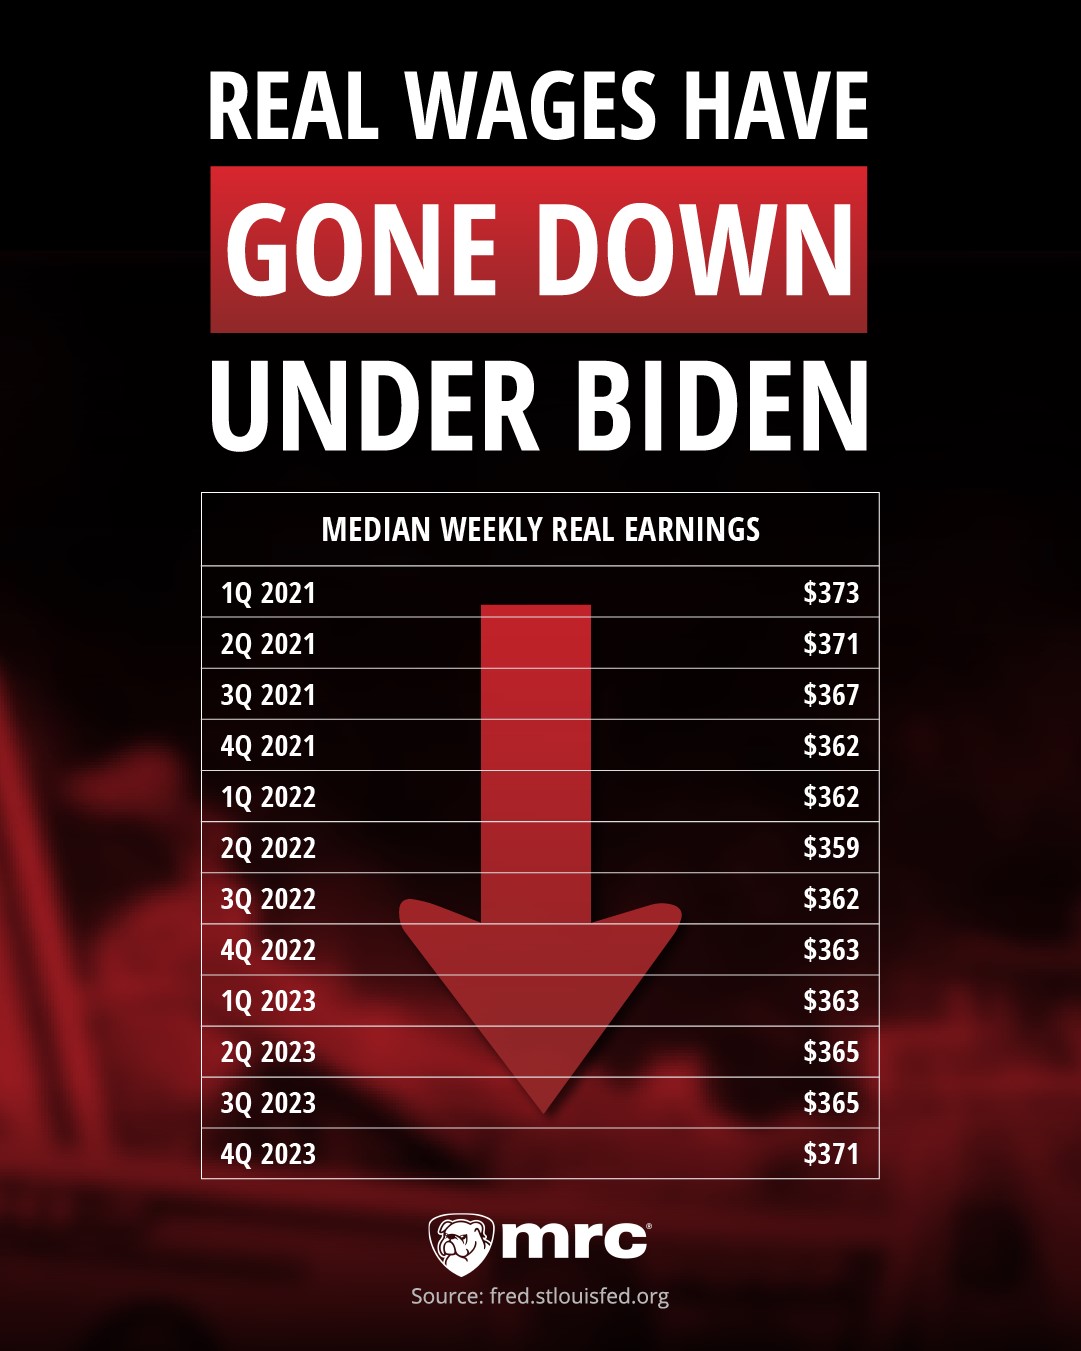
Real Wages:
After accounting for inflation, real wages earned by Americans have declined under Biden. In the first quarter of 2021, median weekly real earnings averaged $373. But, by the fourth quarter of 2023, average real earnings had fallen to $371.
Under Trump, however, real wages rose from $352 on January 1, 2017, to $373 on January 1. 2021.
Real wages are calculated using Bureau of Labor Statistics (BLS) median usual weekly earnings for full-time employees at least 16 years old and are represented in terms of quarterly 1982-84 Consumer Price Index (CPI) seasonally-adjusted dollars.
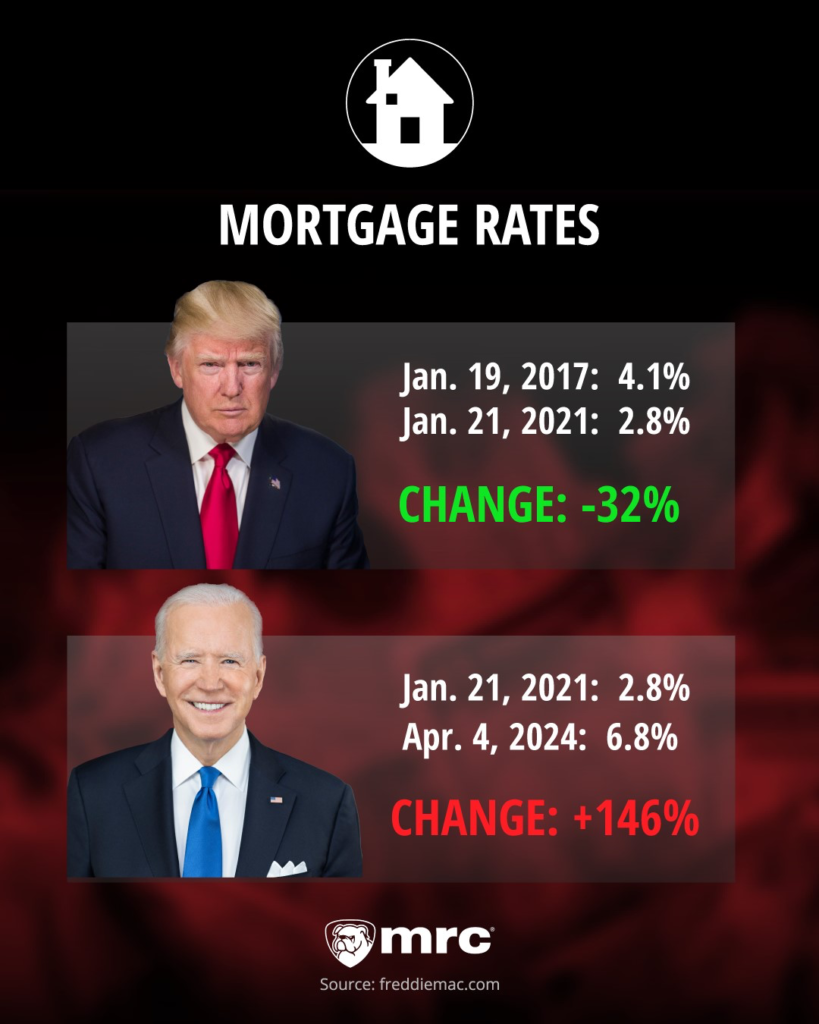
Mortgage Rates:
It’s also costing far more to finance a home purchase under the Biden Administration.
Mortgage rates today are more than twice the average rate home buyers paid when Trump left office, Freddie Mac data reveal. Under Biden’s predecessor, the average 30-year fixed mortgage rate fell by a third, from 4.09% to 2.77%. But, by April 4, 2024, mortgage rates had more than doubled, to 6.8%.


Échanger avec des Salopes de 18 ans Sexe en ligne est une périple merveilleuse. Leur raffinement et leur attirance rendent chaque chat souvenir.